2022 has been an interesting year so far; from geopolitical events unfolding in eastern Europe, continuing supply bottleneck that saw commodities skyrocket, 30-year historical inflation rate, and one out of only a few years where both stock and bond markets synchronously dropped. The S&P500 dropped 22% Year-to-date while Aggregate US Bond index dropped 12.5%.
Such turbulent numbers are not within the comfort zone for many investors, who opted to exit the market with the goal of preserving as much capital as possible, but likely did so at the lowest market point or near. To be fair, no economist can point at a chart and declare that “this is the lowest point the market will get to this year”. However, we’ve come to observe that market drops usually happen fast and drastic, before hovering around a point recognized later as the max drawdown point for that year.
A prime example for this shows up within the last 30 years. In the early 2000’s, the stock market had 3 consecutive losing years with -9, -12 and -22. However, intra-year losses were even greater at nearly double these numbers; this is definitive of Max Drawdown.
As seen in figure 1, almost every year since 1990 had a negative max drawdown value; and this value has always been lower than realized return, even in negative return years such as 1990, 2000, 2001, 2002, 2008 and 2018. Historically, bear markets start with a sudden hard drop, then begin to move less, before beginning to pick up. The average time it took for the market to recover is around 14 months.
That said, many investors opt to exit the market at the faintest sign of bearish trend. However, we know that the worst decision to make in this scenario is to exit the market and sit on the sideline; not knowing when there will be an upturn is the primary reason behind this. To better demonstrate the difference in outcome during down years, a deeper look into the two most bearish markets, tech bubble burst and the sub-prime mortgage crisis, can better explain.
The Case of ‘00-‘05
Entering the market in 2000 meant that investors had to endure the tech bubble, which many argue has similar characteristics to the first half of 2022, which saw market share price for tech giants like Amazon and Apple dropping low as -38% and -26% year-to-date.
We will look at two hypothetical scenarios, Remain and Exit. In the Remain scenario, an investor x deploys $10,000 at the beginning of year 2000 and stays in the market for 5 years, enduring volatility. In the Exit scenario, investor x deploys the same amount, at the same time, yet feels uncomfortable with the market volatility, deciding to exit the market and wait until year end before re-entering in 2001.Figure 2
By the end of 2005, the variance between the two scenarios is obvious. The Remain scenario would’ve ended the 5-year investment timeframe with $9,391 or -2.5% total return rate from the original $10,000. While the Exit scenario’s portfolio value would’ve been $8,566 or –14.3% total return rate.
The Case for ‘08-‘13
Next, we examine the same scenarios, only during the subprime mortgage crisis of ‘08, assuming investment timeframe horizon of 5 years. Both scenarios assume that investor x deployed $10,000 in the beginning of 2008, the year that saw the stock market plummet as low as 47%, causing rippling global effects that lasted for years.As in the previous case, the variance between the two scenarios’ end value is apparent. The Remain scenario would’ve ended the 5-year investment timeframe, with $14,257 or 6.1% total return rate. While the Exit scenario’s portfolio value would’ve been $11,768 or 2.8% total return rate.
Conclusion
The objective behind most investing strategies is to maximize return without exposing one’s portfolio to unnecessary risk. Based on the findings above, it can be argued that exiting a sliding market is a costly mistake that’ll take away from potential future gains working against investor’s interest. Since 1990s, the market always closed at a higher return than its intra-year worst. Therefore, allowing the cycle to run its course prevents the costly mistake of existing at a lower rate. As a result, adding more years to the investing plan in order to achieve one’s goals

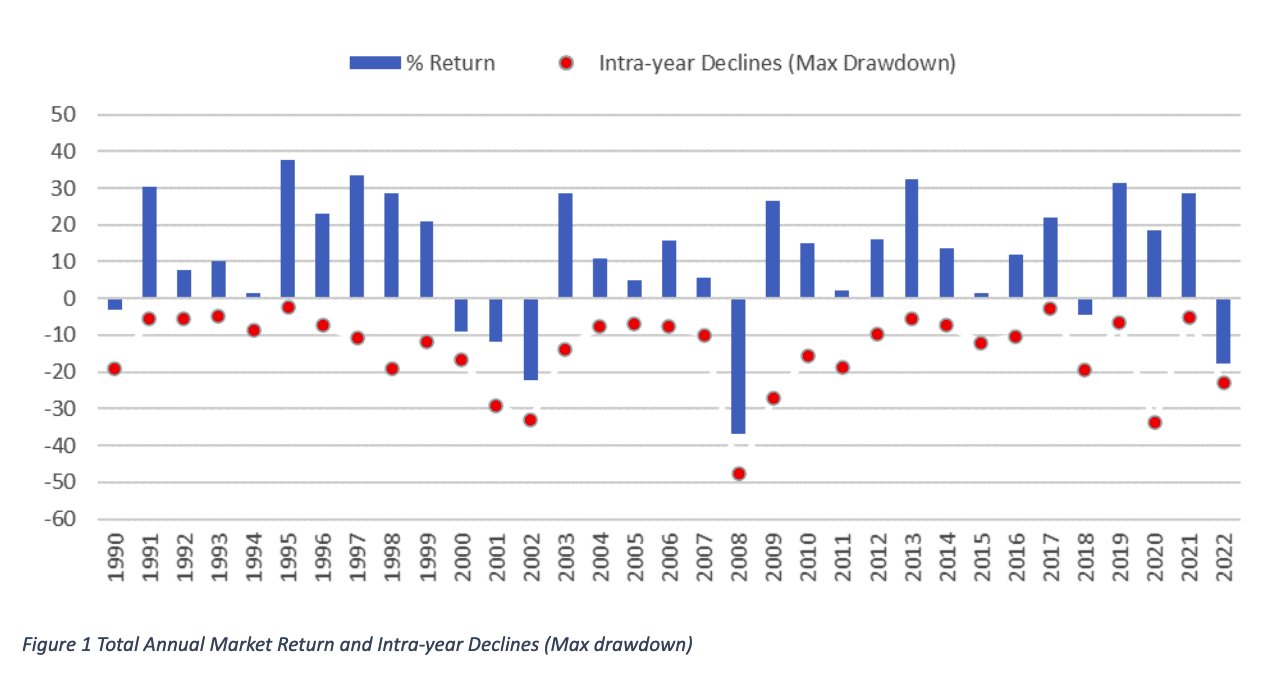

 Figure 2

